It was long overdue! One of the oldest parts of EasyRoute has been revamped!
New Tricks
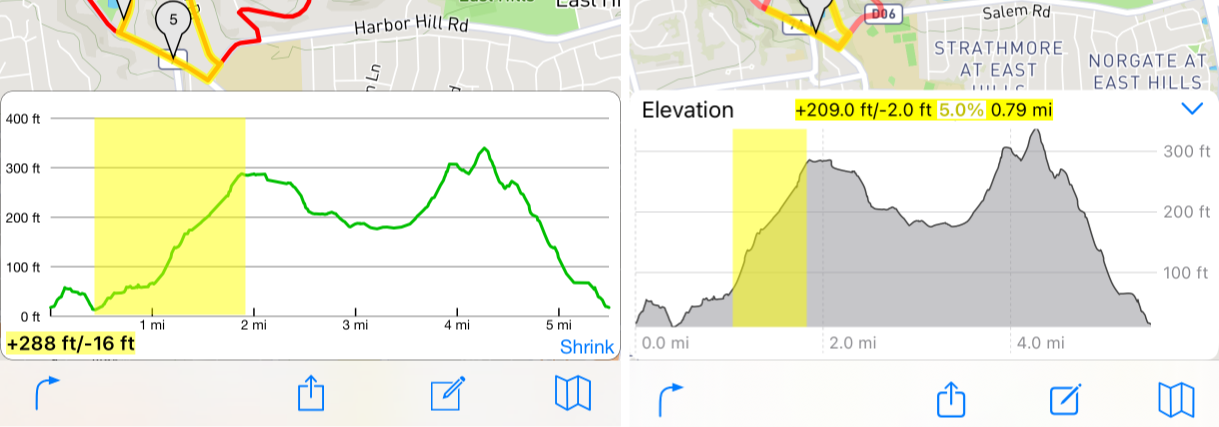
In addition to looking nicer, it’s got a few new features.
Notes
The new elevation chart requires iOS or iPadOS 17 as it is built on some components that are only available in the latest releases.
In addition to the new chart, this release contains some bugs fixes and improvements around importing a route. It also fixes a bug where some extraneous depart and arrive maneuvers might appear in the middle of the route after you drag some points around.
Technical Stuff
The new elevation chart is a Swift Chart. SwiftUI is actually pretty fun to work with and I’m glad I’m getting to integrate more of it into the main iOS app. The watchOS app has been completely ported to it, but the main app is much larger so it’s definitely not going to be converted in one shot. Just as I’ve been judiciously replacing Objective-C with Swift over the years1, SwiftUI will replace the old UIKit code where it makes sense as well.
The old elevation graph is Objective-C and Core Graphics. It’s pretty simple but pretty inflexible drawing code. Using an actual chart component opens the door for more improvements and visualizations in the future, so stay tuned for that.
As usual, hit me up using my contact form if you have any questions, comments or feedback.
- EasyRoute started before the Swift programming language was released to the public so at one point it was 100% Objective-C, and now almost 10 years later, it’s over 90% Swift. ↩︎